
Understanding the ROI from Your Virtual Tour
Virtual tours look great. Everyone agrees on that.
But sooner or later, the same question always comes up - what’s the return on investment?
Are people actually using the tour? Does it help generate enquiries or bookings? And can you prove it?
When you use Matterport virtual tours with overlays, you’re not guessing. You can track what people do, how they engage, and what actions they take next.
Let’s walk through this step by step, from simple tracking to more advanced options, so you can understand the ROI from your virtual tour in a way that actually makes sense.
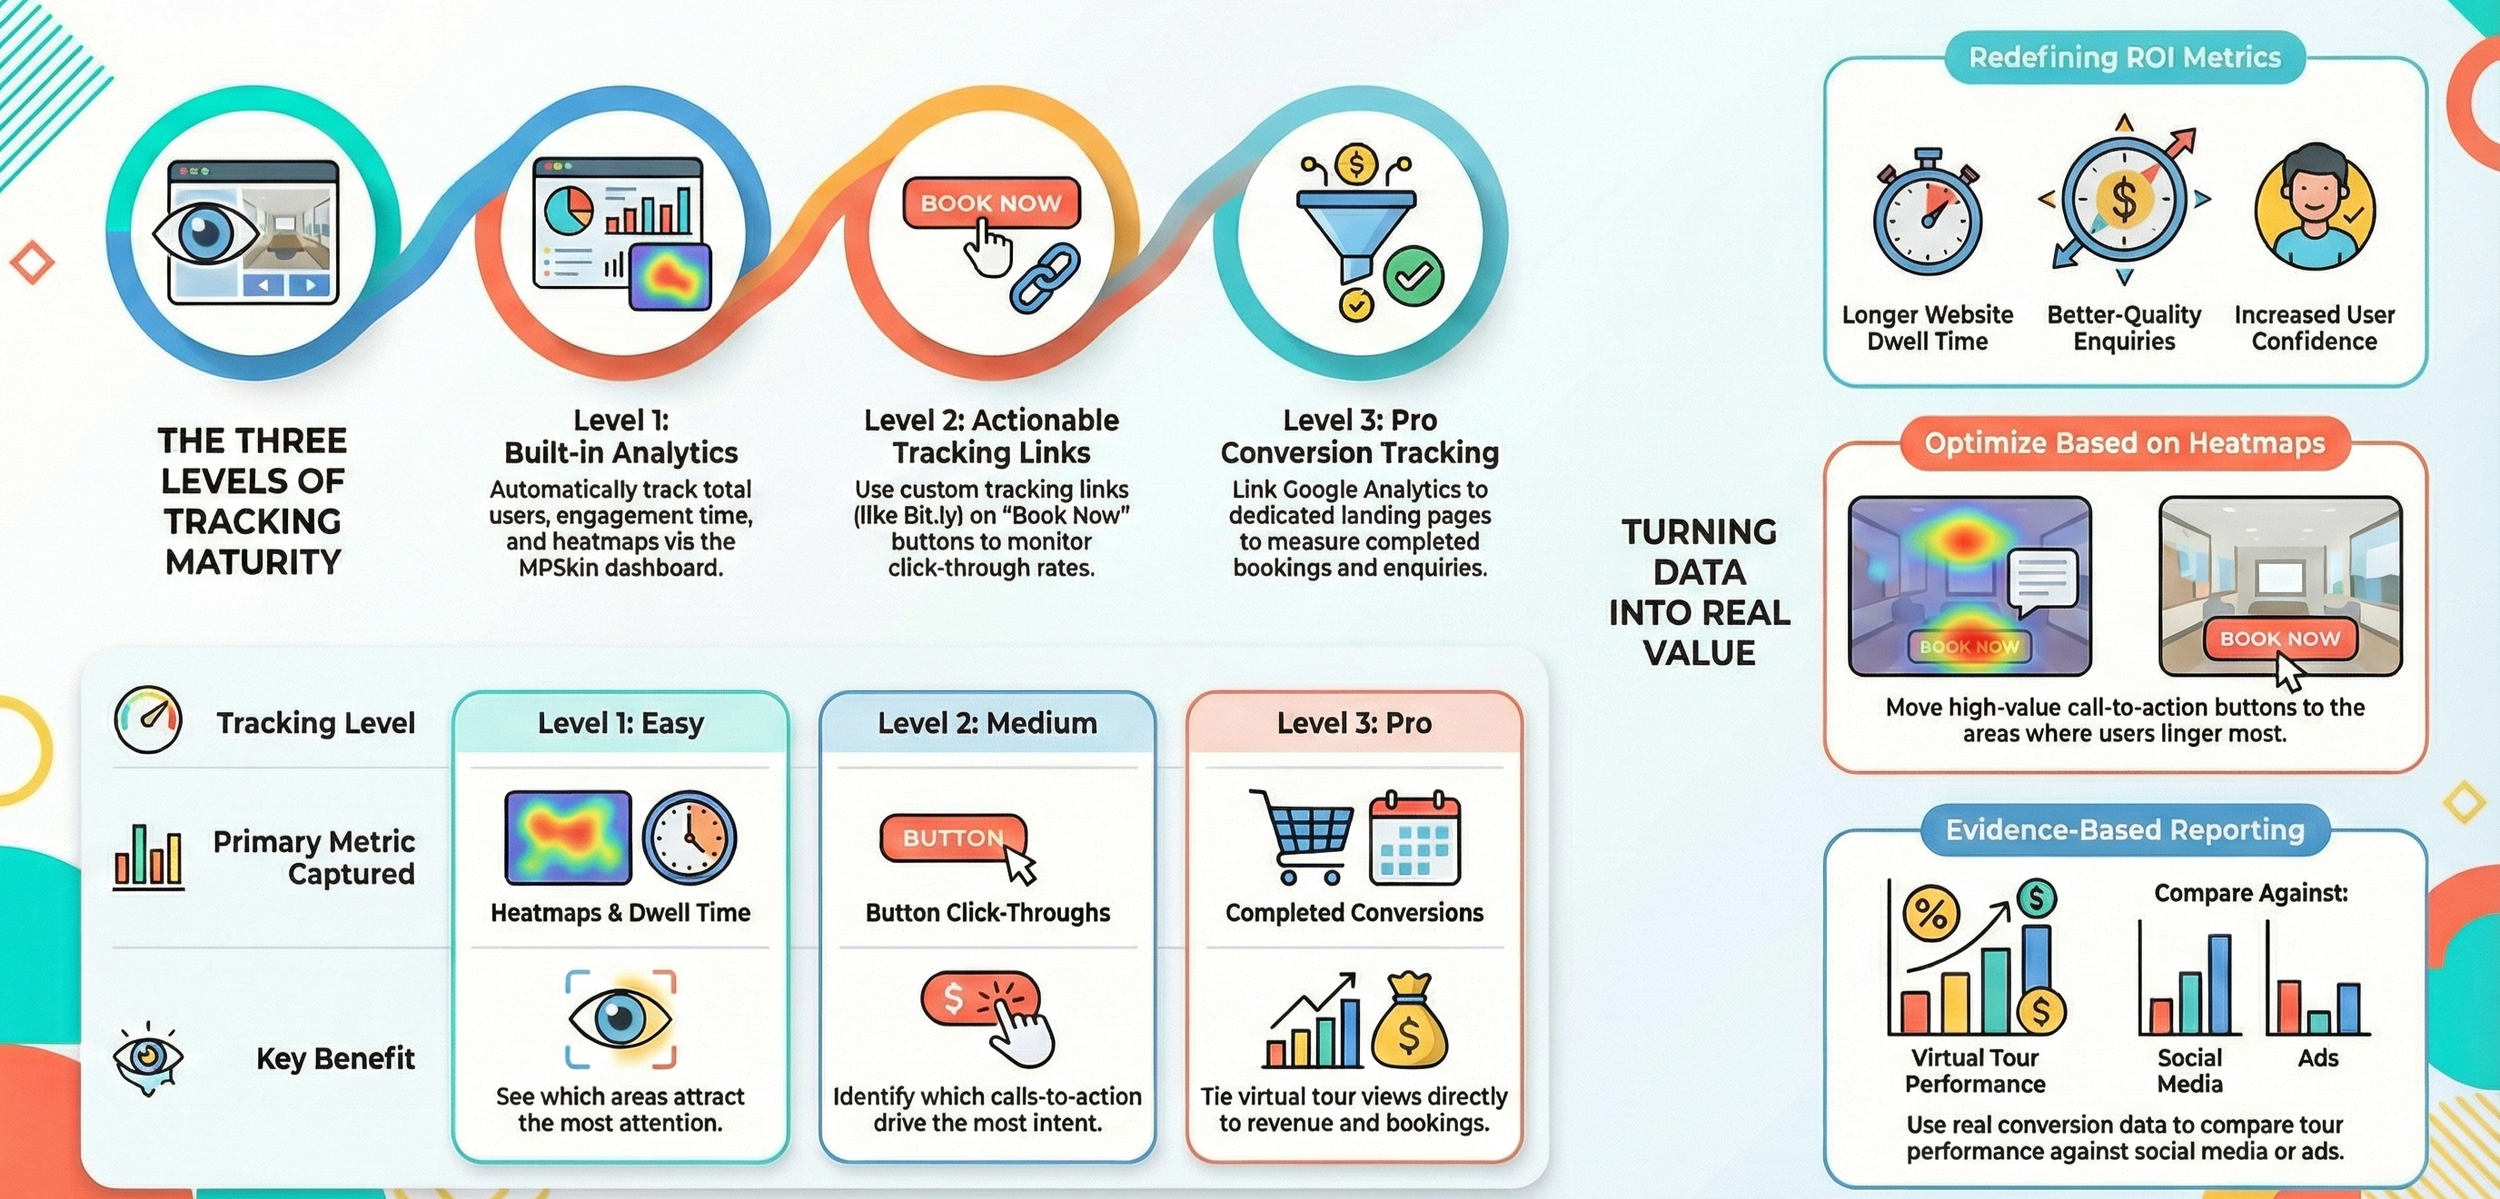
What ROI really means for virtual tours
ROI doesn’t always mean instant sales.
For virtual tours, ROI often shows up as:
Longer time spent on your website
Better-quality enquiries
Fewer basic questions from prospects
More confident users who already understand the space
Clear data that shows interest and intent
The key is tracking behaviour, not assumptions. That’s where MPSkin and smart link tracking come in.
Level 1 Tracking (Easy) - MPSkin built-in analytics
This is the easiest place to start and requires no technical setup.
MPSkin includes its own analytics dashboard that shows:
Total users
Unique users
Engagement time
Simple graphs to spot trends
A heat map highlighting the most viewed areas in the tour
All of this data is collected automatically once the tour is live.
Why this matters
You can confirm people are actually viewing the tour
Engagement time shows interest, not just clicks
Heat maps reveal which areas attract the most attention
Example (to show how this can help)
Imagine a hotel virtual tour where the heat map shows guests spending most of their time in the rooms and spa area, while other spaces are barely viewed.
That insight could lead you to:
Add clearer info hotspots in those popular areas
Move key call-to-action buttons closer to where users linger
Focus future marketing on the spaces people clearly care about
This won’t happen automatically, but Level 1 tracking gives you the clues needed to make smarter decisions.
Level 2 Tracking (Easy) - Tracking links inside your virtual tour
Level 2 is about tracking actions, not just views.
If your virtual tour includes buttons like:
Book now
Reserve a table
Enquire today
Check availability
You can use tracking links (Bit.ly or similar) instead of standard URLs.
How it works
Create a tracking link that points to your booking or enquiry page
Use that tracking link inside your MPSkin overlay
Monitor how many times the link is clicked
That’s it. No coding required.
What this tells you
How many users clicked from the tour to your website
Which buttons get the most engagement
Whether people are taking the next step after exploring the space
Example
Let’s say your virtual tour has three different “Book now” buttons in different areas. Tracking links might show that one button gets far more clicks than the others.
That insight could help you:
Remove or reposition low-performing buttons
Double down on the placement that works best
Simplify the tour experience to guide users more clearly
Again, this is an example of how the data can be used, not a guaranteed result.
Level 3 Tracking (Pro) - Conversion tracking with Google Analytics
This level is for businesses that want clear, measurable ROI tied to real outcomes like enquiries or bookings.
It takes a bit more setup, but it gives you the clearest picture.
Step 1 - Create a dedicated landing page for the virtual tour
Create a unique page specifically for users coming from the virtual tour, for example:
www.yourdomain.com/book-now-virtual-tour
This page should:
Match the messaging used inside the tour
Focus on one main action (booking or enquiry)
Remove unnecessary distractions
Step 2 - Create a unique submission success page
After a booking or enquiry is completed, send users to a unique confirmation page, such as:
www.yourdomain.com/submission-successful-virtual-tour
This page is what allows Google Analytics to track a completed conversion.
Step 3 - Set up tracking in Google Analytics
In Google Analytics (GA4):
Go to Admin
Navigate to Events
Create or mark an event that fires when the success page loads
Mark that event as a conversion
Now, every completed enquiry or booking via that page is recorded.
Step 4 - Link everything back to your virtual tour
Link your MPSkin overlay buttons to the dedicated booking page
Monitor traffic and conversions from that page
Compare performance against other channels like ads or social media
Example
If Google Analytics shows that users who arrive via the virtual tour convert at a higher rate than other visitors, that’s strong evidence the tour is adding value.
Even if conversion rates are similar, you may still see longer session times or better engagement, which also feeds into ROI.
Turning tracking into real value
Data alone doesn’t create ROI. Decisions do.
Once tracking is in place, you can:
Improve button placement inside the tour
Add stronger calls-to-action in high-interest areas
Adjust messaging based on what users engage with most
Confidently report performance using real numbers
These improvements don’t require a new tour. They come from understanding how people already interact with the one you have.
Final thoughts
A Matterport virtual tour with MPSkin overlays isn’t just a visual tool. It’s a measurable marketing asset.
You don’t need to jump straight to advanced tracking. Start simple. Learn how users behave. Build up from there.
Whether you stop at basic analytics or go all the way to full conversion tracking, the important thing is this - you’re no longer guessing. You’re measuring.
And that’s where real ROI starts.